Reviews
Factory tour budgeting questions to compare regional options before 2027
Factory tour budgeting questions for 2027 compare ticket revenue, guide pay and break-even attendance across regional sites and season length.
What to take away
- Build one budget per site, not one budget per brand. A preserved furnace and a working line carry different fixed costs.
- Compare four lines before anything elseticket revenue, cost per guest, guide pay, and break-even attendance.
- Worked examplefixed cost $18,000, a $28 ticket and a $9 variable cost per guest give a $19 contribution margin and a break-even of 948 guests.
- Use published wage and mileage figures, not last year's assumptions. Rates move.
- Write every open cost question into a decision log with a source, an owner and a date.
- Test one change at a time. Two changes at once and you learn nothing about either.
The budget lines that decide a regional tour
Budget lines that decide
| Budget line | What to compare |
|---|---|
| Ticket price | Does it cover the full visit at this site's capacity? |
| Cost per guest | Supplies, guide time, cleaning, and any consumables. |
| Guide pay | Hourly rate, payroll load, and overtime for a long day. |
| Break-even | Paid guests needed to cover fixed plus variable cost. |
| Travel | Shuttle runs or staff mileage to and from the site. |
| Payment fees | What the card processor and booking platform take per ticket. |
Run the same six lines against each regional option, then compare the answers side by side. The tour options checklist sets out the formats worth pricing before you commit a season to one.
Six budget lines to compare
- Ticket pricecovers full visit at capacity
- Cost per guestsupplies, guide time, cleaning
- Guide payhourly rate plus payroll load
- Break-evenpaid guests to cover all costs
- Travelshuttle runs or staff mileage
- Payment feescard processor and booking platform
Two named regional sites, one method
Two named sites make the comparison concrete. The outdoor side is the yards and the Hoover-Mason Trestle walkway at SteelStacks in Bethlehem, Pennsylvania, on the former Bethlehem Steel plant. The indoor side is the gallery floor at the Charles River Museum of Industry and Innovation in Waltham, Massachusetts, in a former mill building.
A typical northern season gives an outdoor industrial route about 150 to 200 open days, and weather cancels an estimated 15 to 30 of them. An indoor gallery typically opens 250 days or more and loses almost none to weather. Those are typical ranges. Each site's own calendar decides the real figure, so read it before you compare.
2027 matters because the rates and windows that set the budget are still moving. The IRS mileage rate for 2027 is published late in 2026, so budgets built now carry the 2026 figure of 67 cents a mile. OEWS wage estimates publish about a year after the survey period, so a 2027 line uses the newest published vintage.
Group bookings for a season normally open six to twelve months ahead, which puts the 2027 window in 2026.
Outdoor yard vs indoor gallery
Outdoor historic yard
- Ticket price
- $28
- Capacity
- 30 guests
- Variable cost
- $7
- Margin per guest
- $21
- Weather exposure
- High
- Staffing
- Varies
Indoor gallery
- Ticket price
- $32
- Capacity
- 18 guests
- Variable cost
- $11
- Margin per guest
- $21
- Weather exposure
- Low
- Staffing
- Varies
At a guide rate of $18 an hour plus 15 percent payroll load, a three-hour tour costs about $62 in direct labor.
Twenty guests at $28 bring in $560; Stripe takes about $22.24 at 2.9 percent plus 30 cents, leaving $537.76.
Set the two named sites on the same lines. SteelStacks and the Charles River Museum publish different ticket prices and session capacities, and the outdoor route loses days that the indoor route keeps.
If the outdoor route holds 30 guests at $28 and the indoor gallery holds 18 at $32, with variable costs of $7 and $11, both return $21 per guest. Capacity, weather exposure and staffing still differ, and that difference is the decision.
The Visitor Use Management FAQ is the right screen for whether a budget change answers a real local condition rather than a preference.
Where the public figures come from
- Bureau of Labor Statistics Occupational Employment and Wage Statistics (OEWS): metro wage estimates for tour guides, ticket clerks and maintenance staff.
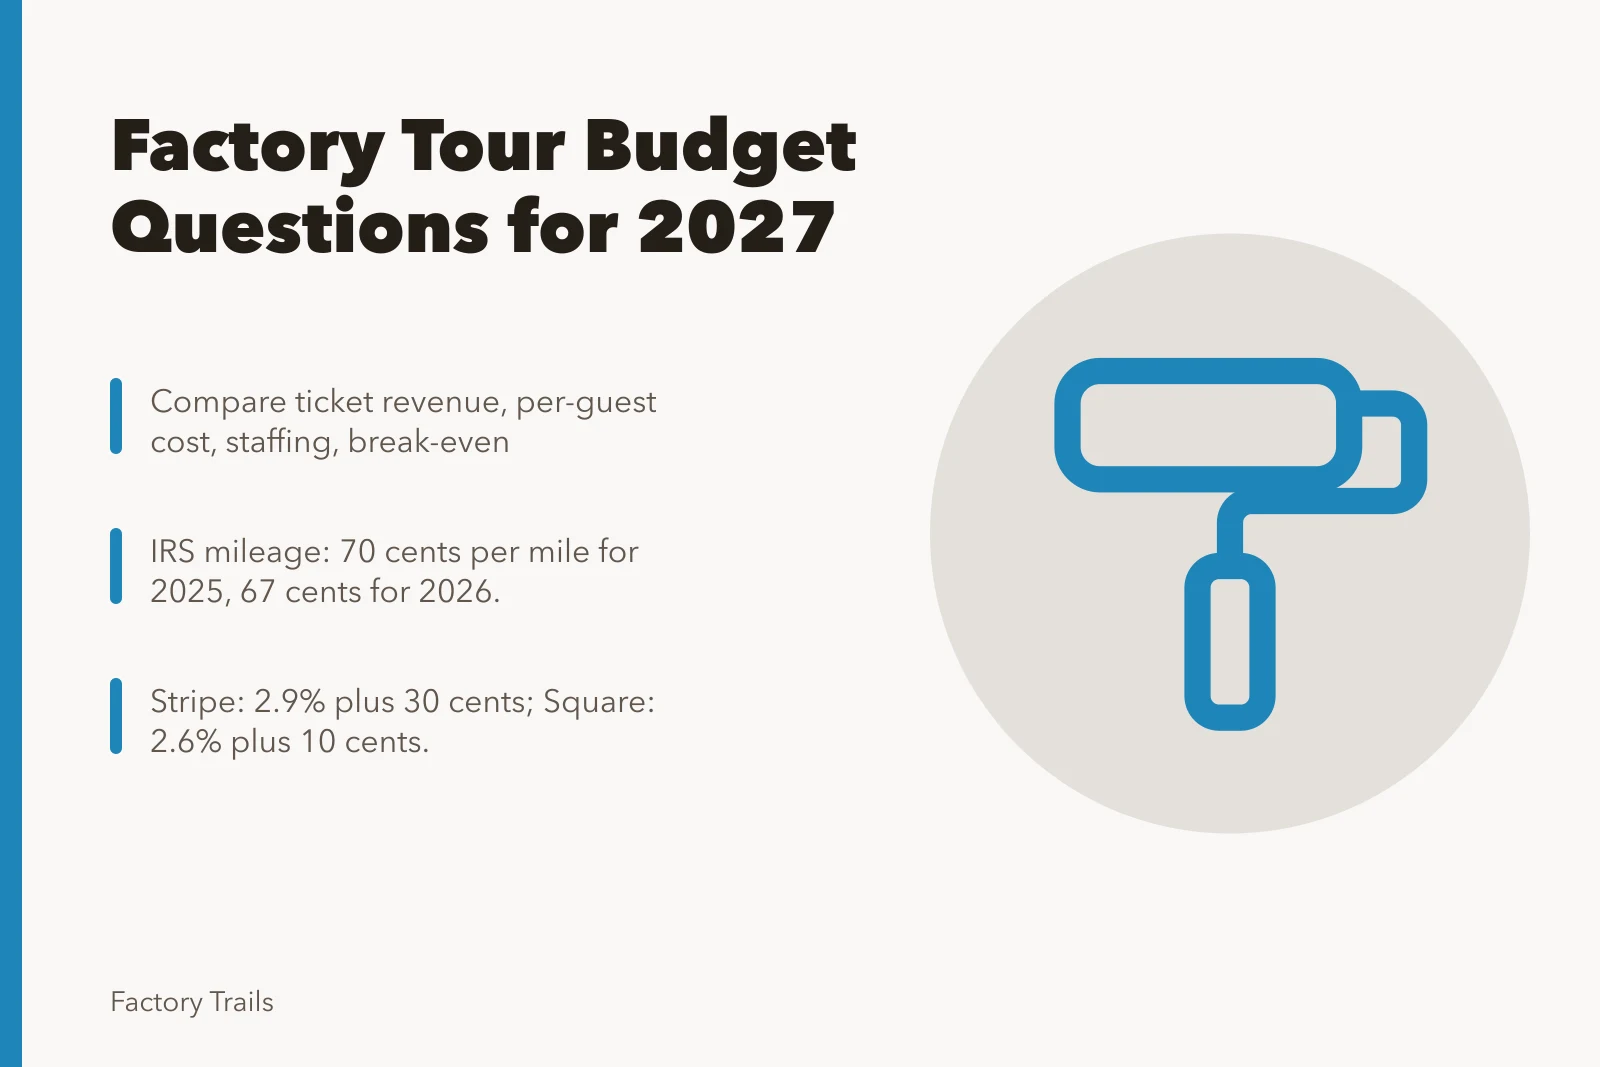
- IRS standard mileage rate70 cents a mile for 2025 business driving, 67 cents for 2026, for shuttle or staff travel.
- Stripe2.9 percent plus 30 cents per successful online charge. A $28 ticket loses about $1.11.
- Square2.6 percent plus 10 cents in person. A $28 ticket loses about 83 cents.
- FareHarborbooking software billed per booking, so low-volume sites pay less than on a flat monthly plan.
- Eventbriteservice fees on paid tickets; free listings publish without ticket fees.
- QuickBooks Onlinemonthly subscription tiers for small operators tracking tour budgets.
- Google Sheetsfree with a Google account, enough for a break-even model.
Confirm every rate with the provider before it enters a budget. Published pricing changes, and a stale line is worse than a blank one.
Price, access and the visitor promise
The National Park Service interpretive planning program starts with visitor outcomes. Ask what the group actually learns, what the cheaper option leaves out, and which local condition forced the change. Two formats are not equal when cost and access differ.
The Department of Justice effective communication guidance treats communication as dependent on context and complexity. Apply that to booking pages. A first-time guest should see total cost, arrival route, timing, format and a contact method before paying.
The National Archives records management profile assigns responsibility for records and information. Give every open budget question a source, an owner, a date and a next action, and keep it visible until it closes.
None of this replaces the site's own rules. Induction, PPE and photography permissions come from the plant's safety officer, and mobility questions belong with the site's accessibility statement.
Run one change at a time
Use the regional comparison questions to test a single route format, meeting instruction or seasonal adjustment. If several conditions moved together, say so in the review and treat the result as weak evidence.
Before the next booking window, read the budget answers beside the public page. Fix any wording that still leans on a condition the local team has not confirmed.
Keep the question form identical across sites, but let the answers differ. Arrival patterns, season length, host coverage and nearby alternatives vary, and the working factory visit guide covers how much that gap shows up in the visitor's day.
Common questions
Should every regional version charge the same price?
No. Price should follow the experience and the operating cost at that site. Where two sites differ materially, say so on the booking page rather than hiding it behind one national figure.
Is a shorter tour always cheaper to run?
Not necessarily. A short session compresses check-in and departure, which can mean more staff on the door for less time. Compare guide pay, payment fees and cost per guest before assuming shorter is cheaper.
What if the alternate route outsells the main one?
Treat it as evidence for making that route the standard seasonal format. Use attendance, host notes and reliability, not preference, to decide, and review again at the end of the season.
Do these figures apply to my site?
Only as a method. Substitute your own fixed costs, ticket price, guide rate and processing rate. Wage and mileage figures come from BLS and the IRS, and your processor's current rate comes from the processor.